Abstract
In this blog post, I will describe my journey while looking for visualization tools for PyTorch. In particular, I will briefly describe the options I tried out, and why I opted for VisualDL. Finally, and more importantly, I will show you a simple example of how to use VisualDL with PyTorch, both to visualize the parameters of the model and to read them back from the file system, in case you need them, e.g. to plot them with another tool (e.g. with Matplotlib).
Introduction
Yesterday, I have been trying to find and use a visualization tool, similar to TensorBoard, but for PyTorch. I find this type of visualization tools very useful, because they allow me to intuitively understand how the model is behaving and, in particular, how certain parameters and hyper-parameters of the model are changing, while the model is being trained and tested. So, this type of tools are especially useful while debugging our programs or if one needs to present the model to other people (e.g. teammates) while it is being trained or tested.
There isn’t still a “standard” tool for visualization in PyTorch (AFAIK). However, there are several “decent” options: TNT, tensorboardX or VisualDL. There may be other options, but these are, apparently, the most popular (that I found), according to the stars of the corresponding Github repositories.
If you perform a search on the web, you will find discussions and questions regarding visualization tools for PyTorch, for example this, this and this.
The options
I tried all three options I mentioned above.
TNT
I first tried to use TNT, which can be used for logging purposes during the training and testing process of our models. TNT actually uses Visdom (which is a quite flexible and general visualization tool created by Facebook) to display the info in the form of plots. Therefore, you also need Visdom as a dependency.
More specifically, I tried to run this TNT example. To successfully run the mentioned example using PyTorch 1.0.0, you need to modify a statement (which was already deprecated, but nobody cared to update the example), which causes an error. See this Github issue (on the TNT Github repo) for more info. I didn’t like much this example (and, generalizing, TNT) because the logic of the program drastically changed (with respect to a “usual” PyTorch program) only to perform the visualization of the evolution of e.g. the training loss. To me, this seemed like a sign of inflexibility. Therefore, I tried to look for other options.
tensorboardX
I then tried to use tensorboardX, which is, right now, among the three options, the one with the highest popularity (in terms of Github stars).
There are several examples which show how to use this tool. You can find them here and here. In particular, I tried this example. To use tensorboardX, we actually need to install TensorBoard and TensorFlow. Apart from the fact that these are not lightweight dependencies, this was also my first time using PyTorch, and the thought of needing to use TensorFlow (which I previously used in other projects) to achieve something in PyTorch made me think that I’d better just stick with TensorFlow and give up on PyTorch. Of course, this doesn’t make much sense, but I just didn’t feel this was the right direction. Therefore, I looked for another option.
VisualDL
Finally, I tried VisualDL (Visual Deep Learning), which is essentially a visualization tool very similar to TensorBoard, whose backend is written in C++, but with both a C++ and Python APIs. Its frontend or web interface is written in Vue. You can find its documentation at http://visualdl.paddlepaddle.org/. Nowadays, most machine learning frameworks and libraries are written in C++ and have a Python API, so, of course, this characteristic of VisualDL seems consistent with many other machine learning tools. One of the goals of this visualization tool is to be “cross-framework”, i.e. not to be tailored to a specific framework (like TensorFlow or PyTorch). I like flexibility, therefore this feature immediately biased me towards VisualDL. In the official website of the tool, it is claimed that VisualDL works with Caffe2, PaddlePaddle, PyTorch, Keras and MXNet. I imagine that in the future more frameworks will be supported.
I first read the README file of the Github repo of VisualDL, the documentation, this tutorial and this example. There are other examples (for other frameworks) you can find here. VisualDL seems to be in its preliminary phases, but you can already accomplish several things that you expect to accomplish with e.g. TensorBoard. For example, you can visualize (more or less in real-time) the evolution of scalar values of your model (e.g. the learning rate or the training loss), you can also plot histograms and visualize the computational graph.
However, this blog post is not dedicated to the explanation and presentation of all features of VisualDL, therefore I let the reader explore by him or herself the remaining features of VisualDL. In the next section, I will show you a brief example of how to use VisualDL with PyTorch and how to read the logging data, once it has been logged (and possibly visualized), using the API that VisualDL already provides.
How can VisualDL be used to visualize statistics of PyTorch models?
Before proceeding, you need to install PyTorch and VisualDL. In this example, where the source code can be found at https://github.com/nbro/visualdl_with_pytorch_example, I installed PyTorch and VisualDL in a Anaconda environment, but you can install them as you please. If you want to exactly follow along with my example, please, read the instructions here on how to set up your environment and run the example.
I will not describe all the details inside this example, but only the ones associated with the usage of VisualDL with PyTorch.
In the file write_visualdl_data.py, to use VisualDL to visualize the evolution of some of the metrics or statistics (specifically, the training loss, the test loss and the test accuracy) of the associated model (a CNN trained and tested on the MNIST dataset), I first imported the class LogWriter from visualdl (line 11):
from visualdl import LogWriterI then created a LogWriter object (at line 13)
log_writer = LogWriter("./log", sync_cycle=1000)where "./log" is the name of the folder where the logging files will be placed and sync_cycle is a parameter which controls when VisualDL will force the logging to be written to the file system. Have a look at the documentation for more info.
Then, at line 158 and 161, I defined the specific loggers (which are of type “scalars”, given that the training loss, the test loss and the test accuracy are scalar values) which will be used to record statistics during respectively the training and testing phases:
with log_writer.mode("train") as logger:
    train_losses = logger.scalar("scalars/train_loss")

with log_writer.mode("test") as logger:
    test_losses = logger.scalar("scalars/test_loss")
    test_accuracies = logger.scalar("scalars/test_accuracy")
What this piece of code tell us is that under the “mode” "train", we are defining the scalar logger train_losses which is associated with the “tag” "scalars/train_loss". Similarly for the loggers associated with the mode "test". VisualDL is actually aware of these modes: they will then be useful to retrieve the logging data from the file system (we will see this in the next example).
The specific scalar loggers train_losses, test_losses and test_accuracies are then passed to the functions train and test at lines 168 and 169. The functions train and test are called at every epoch (inside a loop). Inside the train function, at line 61, we add a “record” to the train_losses logger using:
train_losses.add_record(epoch, float(loss.item()))Similarly, inside test, at line 86 and 87, we add respectively records for the test_losses and test_accuracies loggers.
test_losses.add_record(epoch, float(test_loss))
test_accuracies.add_record(epoch, float(test_accuracy))
The first argument of the add_record method is a “tag” or “id”, which is basically a key that will be needed later to retrieve the epoch associated with the corresponding record (which, in the examples above, is either a loss or an accuracy value). I converted the record values using the function float to make sure they are all floating-point values.
These are the only lines of code I needed to add to the original PyTorch program to obtain logging and visualization functionalities using VisualDL. More specifically, I added about 10 lines, and these lines are quite self-explanatory.
The following picture shows the resulting web interface of VisualDL, after having executed this example and after having waited for the log folder to be created and containing some logging files produced by VisualDL (as explained in this README file):
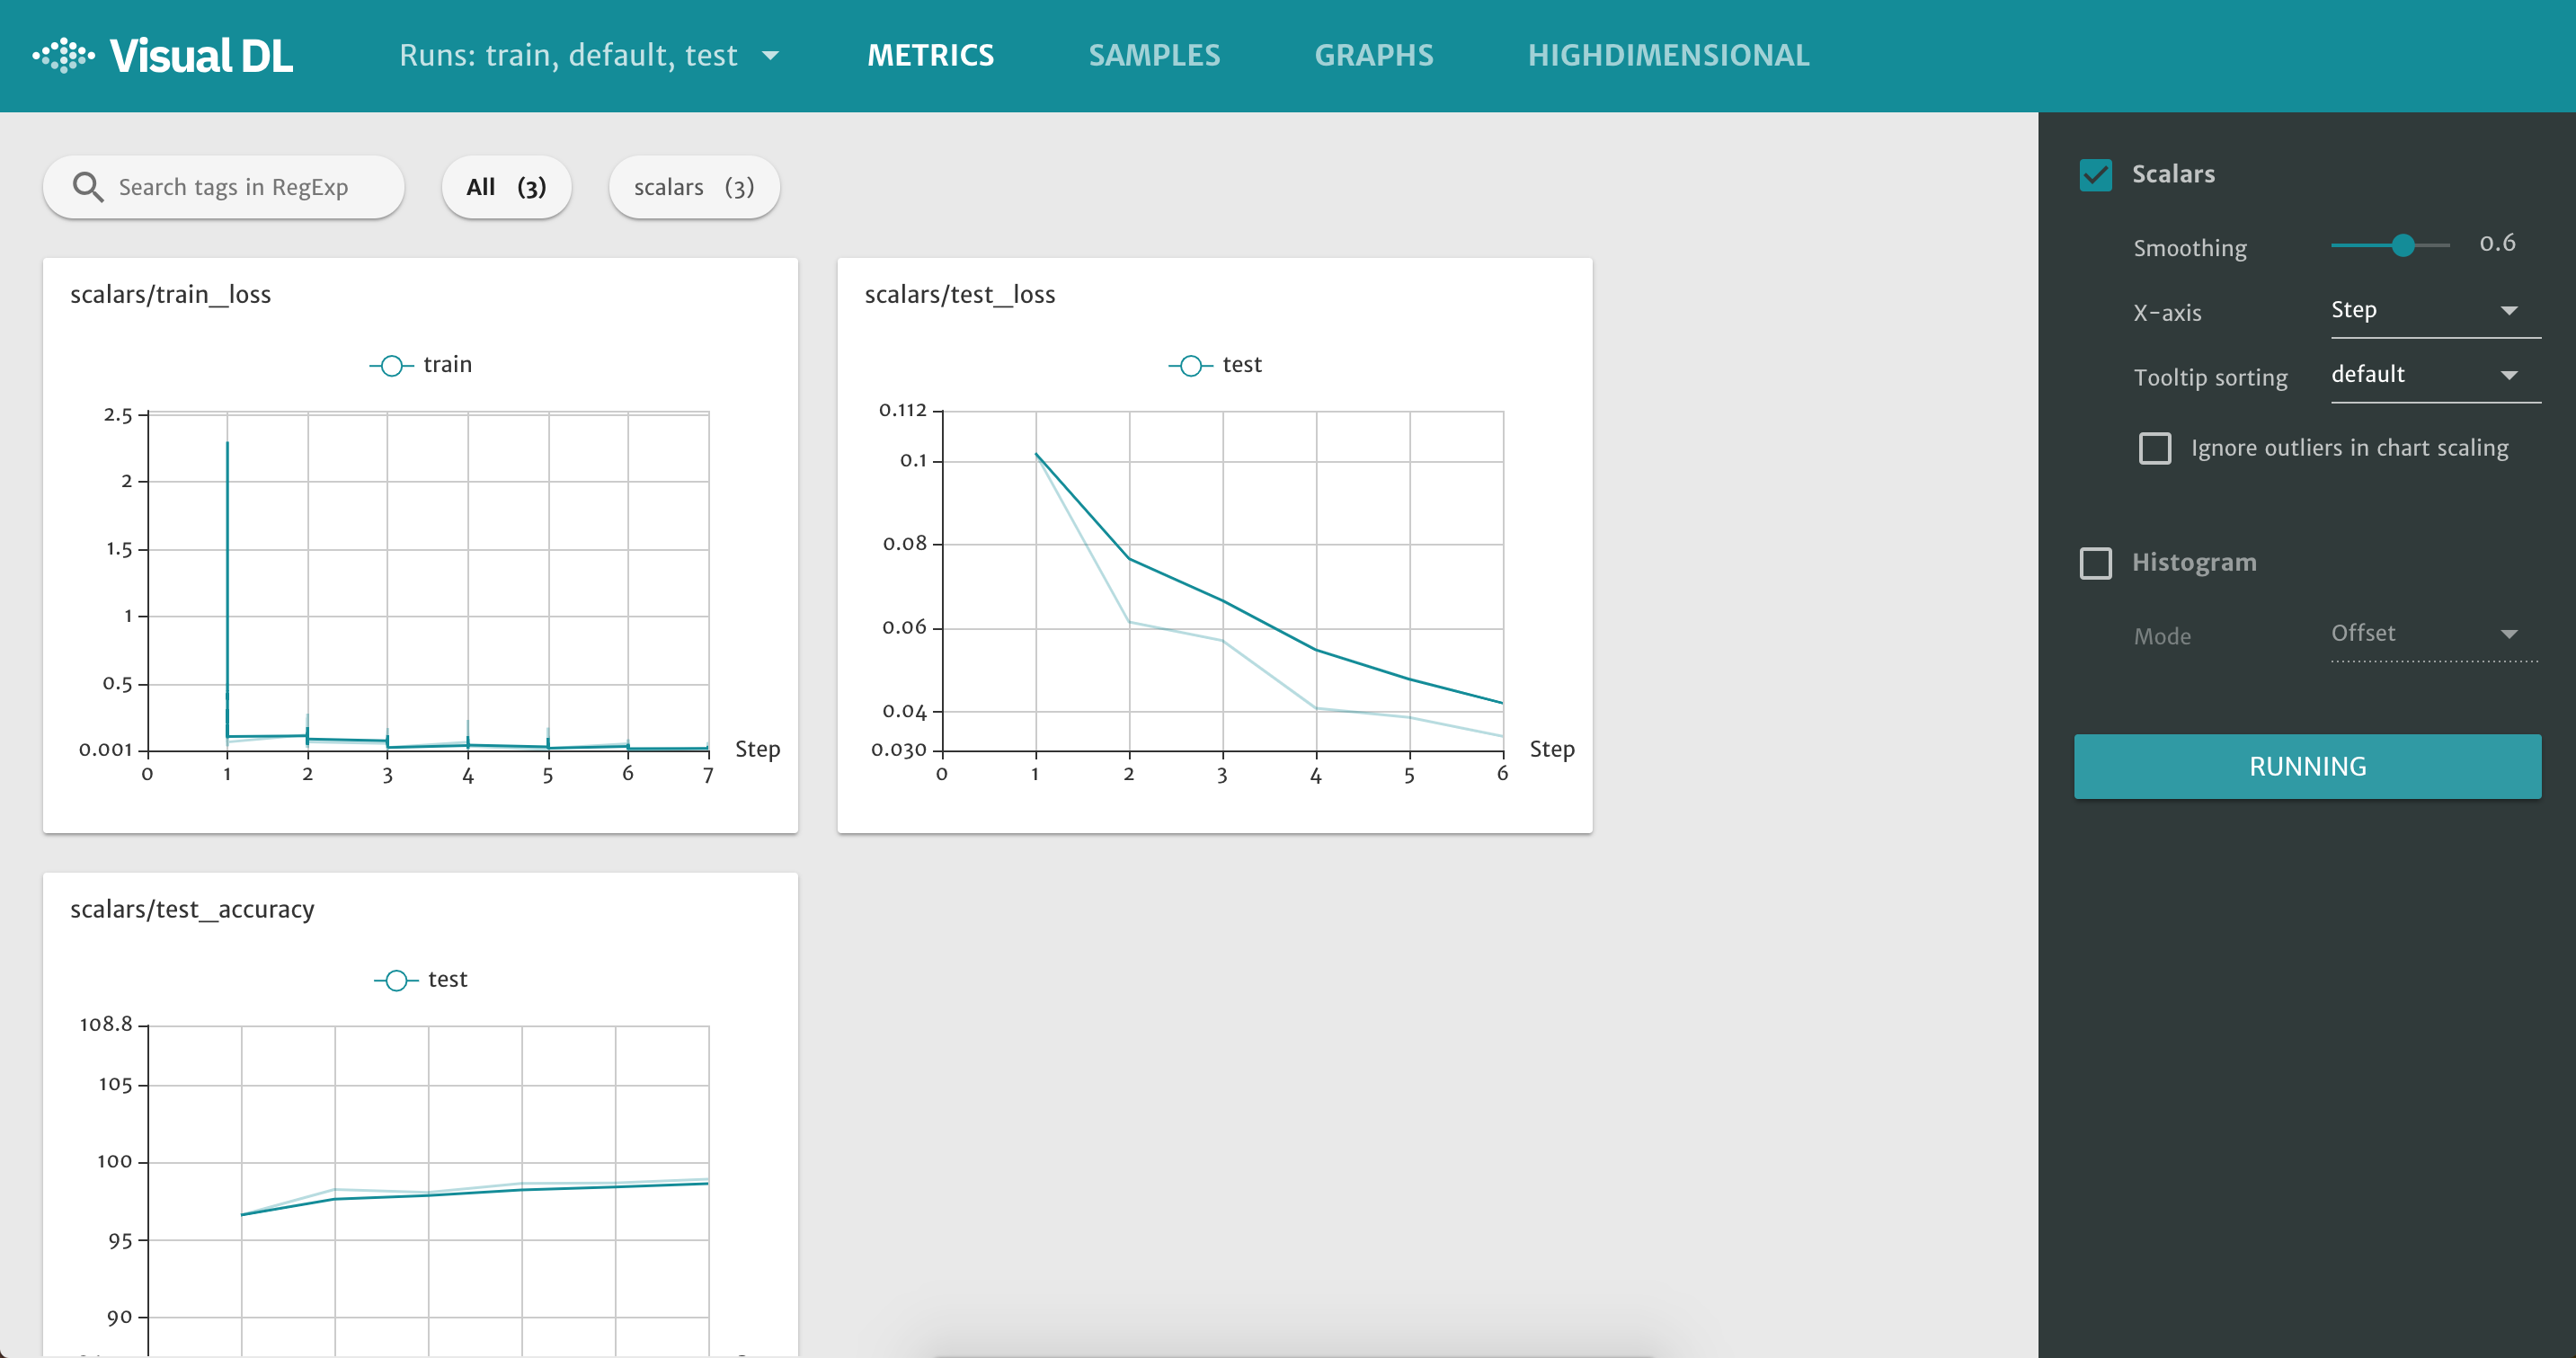
The screenshot does not completely show the bottom plot, but, of course, in the VisualDL web interface, you can scroll down. You can even expand single plots, among other things.
How can we read the logging data produced by VisualDL?
During the training and testing phases of your model, VisualDL will produce some logging files, in our case, under the folder log. These files are in a format which is not human-readable. They are files associated with ProtoBuf (you can ignore this!).
Anyway, VisualDL also allows us to read these files using its API. We may want to do this because we may need to produce Matplotlib plots using the generated data during the training and testing phases.
More specifically, we can read these logging data (previously logged to a file using LogWriter, as explained in the previous example) using LogReader.
The simple Python module read_visualdl_data.py does exactly this. The statements are quite self-explanatory.
But, in particular, I would like to note a few things. First, at line 6, 14, and 22, I am creating a LogReader but in a certain context or “mode”, and these modes correspond to the modes where the LogWriters (in the previous example) had been created (see the example above).
Note that the “ids” correspond to the variable epoch in the previous example.
Anyway, note that you should not run read_visualdl_data.py before write_visualdl_data.py (or, at least, before the log folder has been created and already contains the logging files).
VisualDL has a few problems
I have chosen VisualDL (as opposed to TNT and tensorboardX), but VisualDL has a few problems too. For some reason, at least in my case, the line charts are only displayed after a few minutes: more specifically, in the example above, only towards the end of the second epoch. See e.g. this Github issue. Even worse, I noticed that sometimes the line charts are not displayed at all (i.e. they are blank): in that case, I need to wait for the experiment to finish or I need to restart the VisualDL server in order to see them. I have also encountered a few weird runtime error messages on the terminal (similar to the one described in this issue), the causes of which I don’t yet know with certainty. Furthermore, I would like to note that I only tried to visualize line charts, so it is possible that you will encounter other problems while using other features of VisualDL. Finally, I would like to note that these problems can also be due to my inexperience with VisualDL (i.e. I may have done something wrong!).
Conclusion
In this blog post, I have briefly described three tools which can be used to visualize statistics of our PyTorch models, while they are being trained and tested. I particularly liked VisualDL, and so I provided two examples which show how to use VisualDL with PyTorch: one to visualize the actual statistics and the other to read them back from the file system. VisualDL is still in its infancy, but, hopefully, it will be improved and the bugs will be fixed.